

StatApp – Website Analytics Aggregator: StatApp is a Python script I developed that allows you to collect and aggregate website analytics from multiple sites. This tool is designed specifically for websites that utilise the WP Statistics plugin and the WP Statistics REST API add-on to pull data from each site, allowing us to use the pandas framework to process this data further.
Features and Benefits
- Data Collection: StatApp collects essential website statistics, including visitors and visits, for multiple sites simultaneously. By providing a list of URLs in a simple text file, you can easily gather analytics data for all your websites in one go.
- Data Labelling: Each dataset is labelled with its corresponding URL, making it easier to identify and differentiate the statistics for individual sites. The script automatically adds this labelling information during the data collection process.
- Customisable Timescale Export: StatApp allows you to export analytics data for different timescales, including Yesterday, Today, Week, Month, Year, and All Time. You can easily generate separate CSV files for each timescale & export the complete dataset containing all timescales.
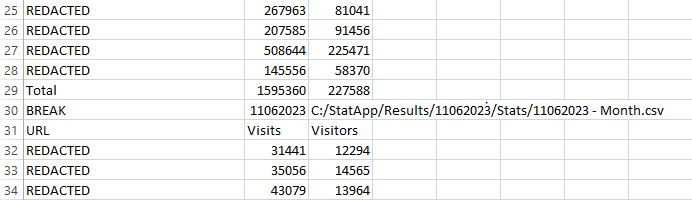
- Data Aggregation: After collecting the analytics data for all the specified sites, StatApp aggregates the data into a single comprehensive CSV file. This file combines the statistics for all sites, making it convenient for further analysis and reporting.
How to Use StatApp
- Setup: Before using StatApp, make sure to provide the necessary configurations within the script. Set the source path, temporary paths, site list file path, authentication token, and desired result path. Defaults are provided for some filepaths.
- Populate Site List: On first start-up, StatApp will create & open a text file named sitelist.txt, please populate it with the URLs of the websites you want to collect analytics for. Each URL should be on a separate line. Make sure to save and close the file before executing the script.
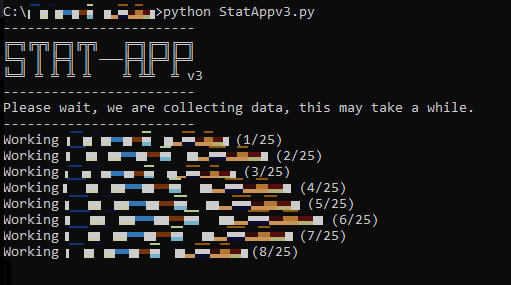
- Run the Script: Execute the StatApp script, sit back, and relax. The script will automatically collect the analytics data for each site mentioned in the site list file.
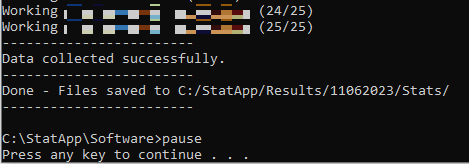
- Access the Results: Once the data collection is complete, the script saves the individual CSV files containing analytics data for each site. Additionally, it creates a consolidated CSV file containing all the data combined. You can find these files in the specified results path.
Important Notes
- Formatting: Ensure that the site list file (sitelist.txt) is correctly formatted. Each URL should be DOMAIN.COM only as it will be prefixed with https://www. and suffixed with /wp-admin within the app. Incorrect formatting may result in errors or unexpected behaviour.
- Risk of Unexpected Crash: Due to potential issues with site list formatting or active processes of required documents, there is a minimal risk of the script crashing without notice. However, this is an acceptable risk given the low volume of users, and no plans for mediation are in place.
- This software is possible to run without user input, allowing for automation to be performed. For example, one deployment of a slightly modified script allows for us to setup a cronjob on a Linux machine, which then email the results to a distribution list via SMTP.
Further analysis utilising geo-location
Recognising the importance of geolocation statistics for the business & acknowledging their potential for enhancing selling capabilities, it was decided to invest efforts to developing and implementing a geolocation data collection tool. I encountered limitations with the existing REST API, so we turned to Selenium—an automated web testing framework—to overcome these challenges. By leveraging Selenium, I was able to gather the necessary data effectively and efficiently, enabling us to unlock valuable insights and maximise selling potential. Selenium also solved the issue I was experiencing in which JavaScript data was not populating in time with more conventional Python scraping methods.
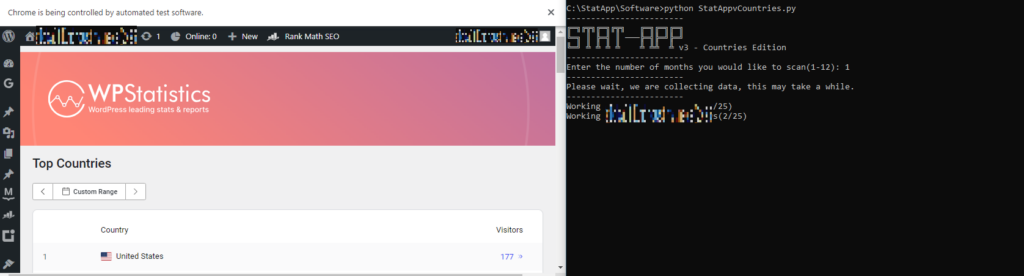
The StatApp Countries Edition is a script designed to collect and aggregate geolocational analytics data from multiple websites. It utilizes web scraping and automation techniques to retrieve visitor information for a specified number of months. The script supports the extraction of country-specific analytics data and provides percentage breakdowns based on visitor counts. The collected data is then saved in CSV format for further analysis.
Features and Benefits
- Multi-site Analytics: The script allows you to specify multiple websites from which you want to collect analytics data. Simply provide the URLs in a text file, and the script will iterate through each site to retrieve the required information.
- Customizable Time Range: You can define the number of months for which you want to collect data. The script calculates the start and end dates accordingly, ensuring that the retrieved data falls within the specified period.
- Automated Data Collection: The script uses Selenium, a web automation tool, to interact with the websites and retrieve the analytics data. It logs into each site using provided credentials and navigates to the analytics page to fetch the required information.
- Data Aggregation: The script consolidates the collected data into a single CSV file. It calculates the total number of visitors for each country and the corresponding percentage of total visitors. The aggregated data is then sorted based on visitor count in descending order.
- Output and Visualization: The script saves the aggregated data as a CSV file, providing a breakdown of visitors by country and their respective percentages. Additionally, it displays a breakdown on the console at the end, showing the visitor count and percentage for each country.
- Various fail safes are present within the file due to unpredictability within WordPress, including URL validation/correction, reauthentication when required & verification of administrative email which appears occasionally on logon.
Usage
- Setup: Before using StatApp, make sure to provide the necessary configurations within the script. Set the source path, temporary paths, site list file path, authentication token, and desired result path. Defaults are provided for some filepaths.
- Populate Site List: On first start-up, StatApp will create & open a text file named sitelist.txt, please populate it with the URLs of the websites you want to collect analytics for. Each URL should be on a separate line, following the format: “example.com“. Make sure to save and close the file before executing the script.
- Configure Credentials: Update the
usernameandpasswordvariables in the script with the appropriate login credentials for the websites you want to collect data from. - Execute the Script: Run the script, and it will begin collecting data from the specified websites. The script will display progress updates as it navigates through each site and collects the analytics data.
- Specify Time Range: Set the
num_monthsvariable to define the number of months for which you want to collect data. The script will calculate the start and end dates accordingly. This variable is set on start-up via user input. - Analyse the Results: Once the script completes, it saves the aggregated data in the “Results” directory, categorised by date and country. The main result file contains the overall visitor count and percentage breakdown for each country. You can further analyse the data using spreadsheet software or other data analysis tools.
Conclusion
In conclusion, StatApp is a user-friendly and powerful tool for website analytics aggregation. By effortlessly collecting data from multiple websites, organising it in a clear and organised manner, and providing customisable export options, StatApp empowers businesses and professionals to gain valuable insights into their website performance as well as save valuable time which would have been spent doing this manually. Unfortunately due to this being a commissioned project I am unable to release source files, but I hope this can spark some ideas for anybody who may come across it!